Information to Help You Manage Your Commercial Business and Inventory
Website Traffic Report
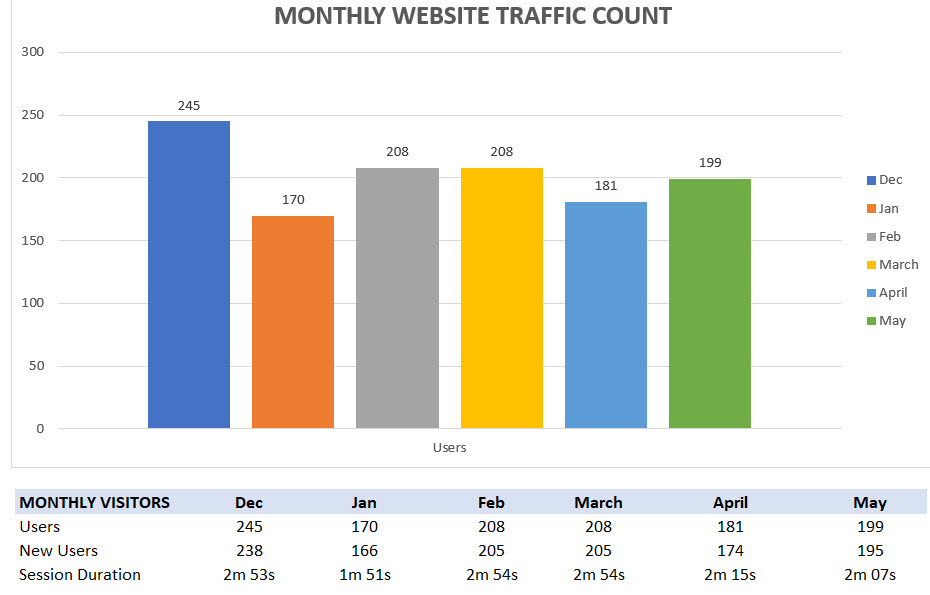
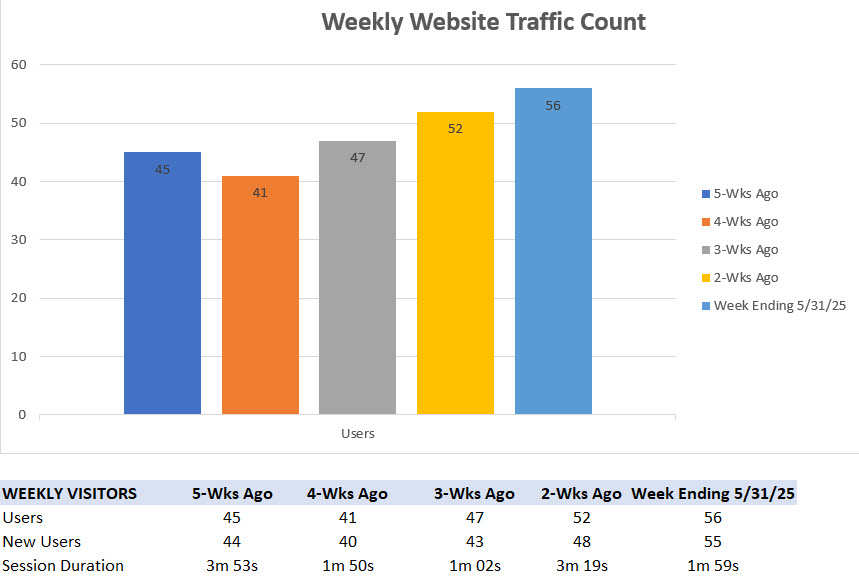
The graphs below represent results from Google Analytics.
The Weekly report represents results from the past 5 weeks. The Monthly report represents results from the past 6 Months.
These reports indicate how well your work truck marketing efforts are working.
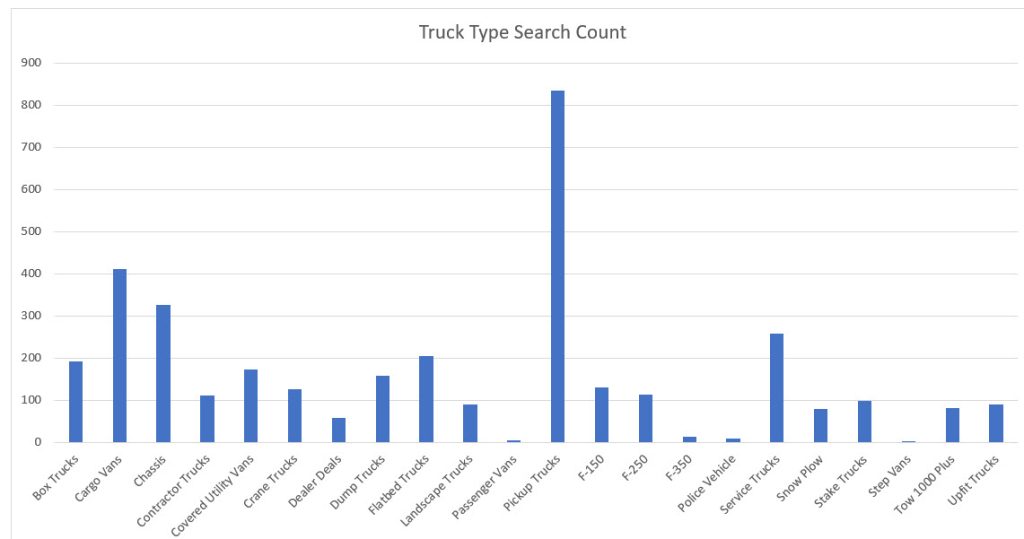
Buyer’s Search Interest
The Buyer’s Interest results are based on the truck type searches initiated by buyers.
The graph below represents the results from the last 4 months.
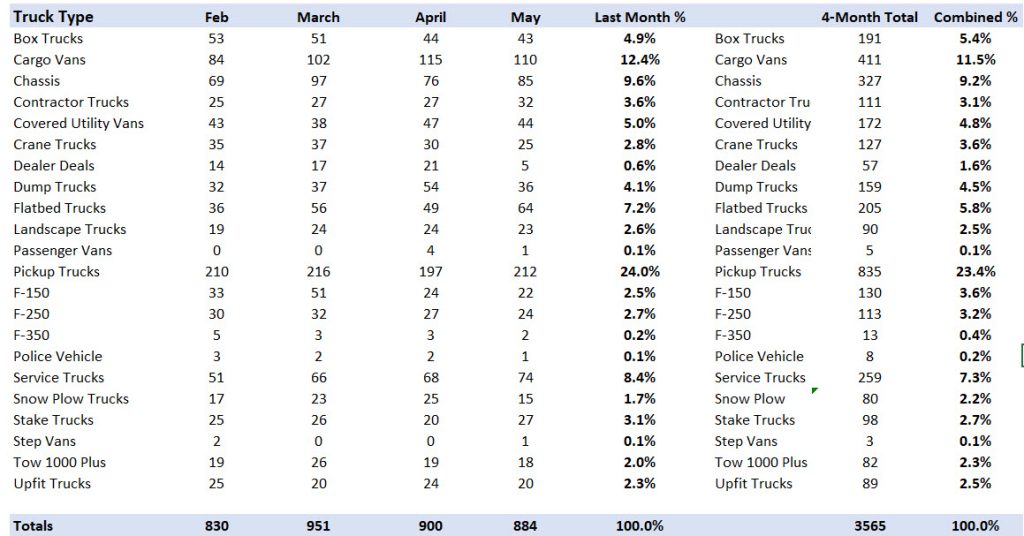
The report below shows the details that the above graph is based upon.
Inventory Inclusion Rules
These can be changed at any time.
F-150 Oxford White with XL Trim, or any Regular or SuperCab Pickups
F-250 Oxford White with XL Trim, or any Regular or SuperCab Pickups, or if the pickup has anyone of these options Snow Plow Prep, Max Tow, or Gooseneck/5th Wheel Hitch Prep
F-350 and F-450 Pickups
All Chassis Cabs & Cutaway
All Transits
Used vehicles that are F-350 or F-450 with low mileage, Chassis Cabs, Cutaways, Upfits or Transits with low mileage